
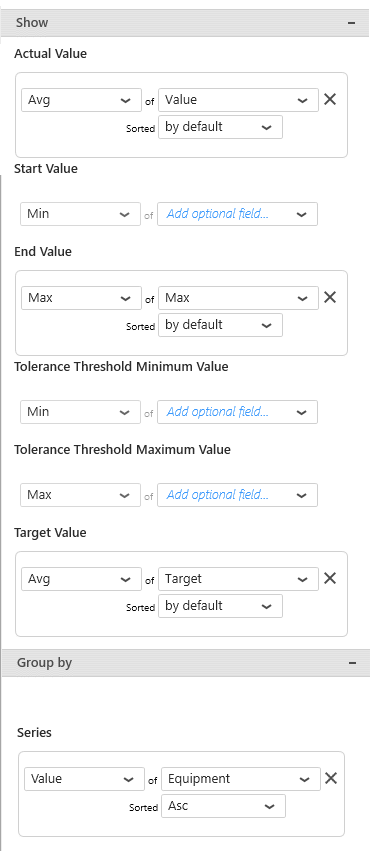
The Circular Gauge has 5 data fields available for binding :
- Actual Value : value displayed as a filling of the Circular Gauge
- Start Value : dynamic minimum value
- End Value : dynamic maximum value
- Tolerance Threshold Minimum Value : dynamic threshold minimum value range
- Tolerance Threshold Maximum Value : dynamic threshold maximum value range
- Target Value : target displayed as an arrow on the Circular Gauge
- Series : how we split series of different gauges in the same container
Actual Value
This represents the primary quantity we want to display on the Circular Gauge, and will bind to the needle position and filling of the Circular Gauge.
This field must be aggregated : you must choose an aggregation function (SUM, AVG, …)
This field is required.


Start Value
This represents the Minimum we want to display on the Circular Gauge, for example the “MinEU” field from Wonderware Historian.
When this field is bound, it overrides manual configuration of the Custom Range Minimum.
If the Actual Value goes below this Start Value, the Circular Gauge will appear empty.
This field must be aggregated : you must choose an aggregation function (SUM, AVG, …).
This field is optional.


End Value
This represents the Maximum we want to display on the Circular Gauge, for example the “MaxEU” field from Wonderware Historian.
When this field is bound, it overrides manual configuration of the Custom Range Maximum.
If the Actual Value goes above this End Value, the Circular Gauge will appear empty.
This field must be aggregated : you must choose an aggregation function (SUM, AVG, …).
This field is optional.


Tolerance Threshold Minimum Value
This represents the minimum of the good range we want to display on the Circular Gauge, and will bind to the minimum of the good zone.
If no maximum is set, all value above minimum will be good.
Tolerance Threshold Maximum Value
This represents the maximum of the good range we want to display on the Circular Gauge, and will bind to the maximum of the good zone.
If no minimum is set, all value bellow maximum will be good.

Target Value
This represents the Target we want to display on the Circular Gauge, and will bind to the position of a small arrow on the Circular Gauge.
When this field is bound, an additional information is displayed as text : the distance from Actual Value to Target Value in units and in percentage.
The Target Value field must be aggregated : you must choose an aggregation function (SUM, AVG, …).
This field is optional.


Series
This represents the series field to generate a different contained Circular Gauge for each different value in this Series field.
Each Circular Gauge will take a portion of size of the widget depending on the container shape. In order to access the other values, the user may need to scroll.
Please see the corresponding chapter to configure the Circular Gauge as Widget container.
Example : If you have a field called “Equipment”, you may want to plot a completely separate Circular Gauge for each value of Equipment :


Post your comment on this topic.