
The Arc Diagram Widgets displays hierarchical data based on a parent child relation.
Arc Diagram points out connections between nodes and renders visual on a horizontal line with each connection represented as an arc. For example, we can visualize the most recurring alarm by a given line and the number of interventions an operator had to apply.
.
The following fields are available for configuring data binding on a Arc Diagram:
• Value : represents the quantitative measure which would eventually determine the size of an arc.
• Level 1 : determines values to be displayed for first level depth arcs
• Level 2 to 6 provide same output as level 1 but are optional
• Split into many widgets: allows to create many sub-widgets dynamically

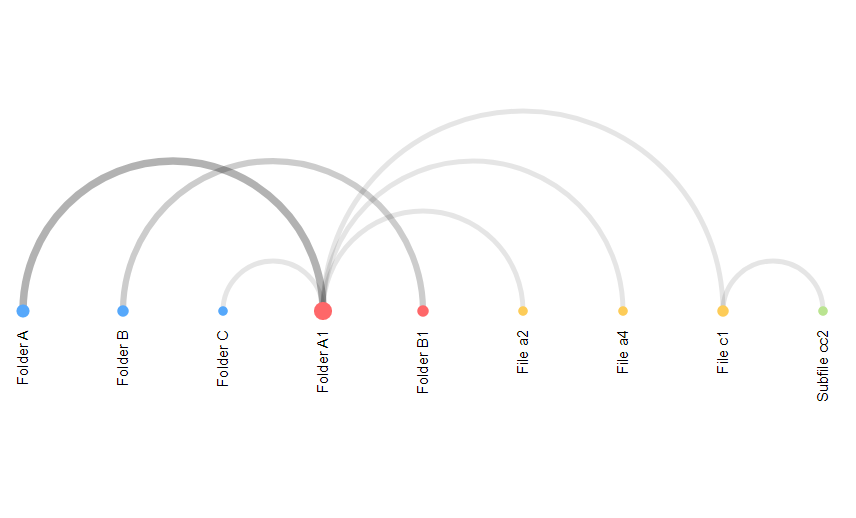
Arc diagram example
Group By : Split into many widgets
This option allows to transform firstly the widget into a container. This will then render an Arc Diagram chart for each different value provided by the selected field.
This allows to create sub-widgets of the same type dynamically which might contribute in increasing granularity.
The layout of the charts inside the container is configurable.
Please see the corresponding chapter to configure the view of the Widget container
Post your comment on this topic.