
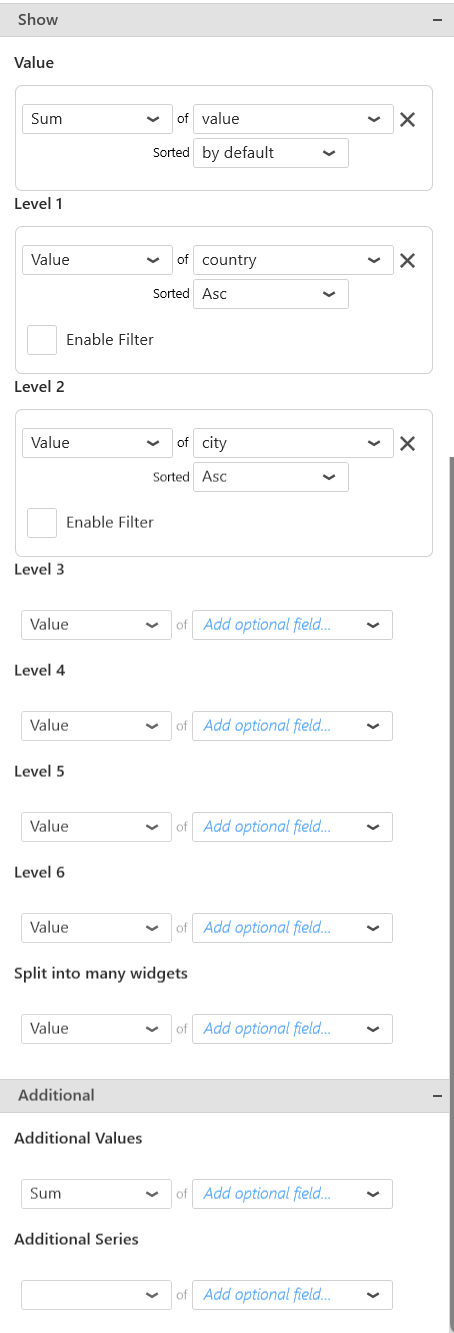
The Sunburst Widgets displays hierarchical data based on a parent child relation. The size of each arc depends on the aggregated sum of values of its siblings.
Sunburst allows different depth levels for each category visually displayed. For example, one might display a geographic hierarchy in which some regions would not contain countries. Yet the reciprocal is false: each child should be associated to an existing parent node.
The following fields are available for configuring data binding on a Sunburst:
• Value : represents the quantitative measure which would eventually determine the size of an arc.
• Level 1 : determines values to be displayed for first level depth arcs
• Level 2 to 6 provide same output as level 1 but are optional
• Split into many widgets: allows creating many sub-widgets dynamically
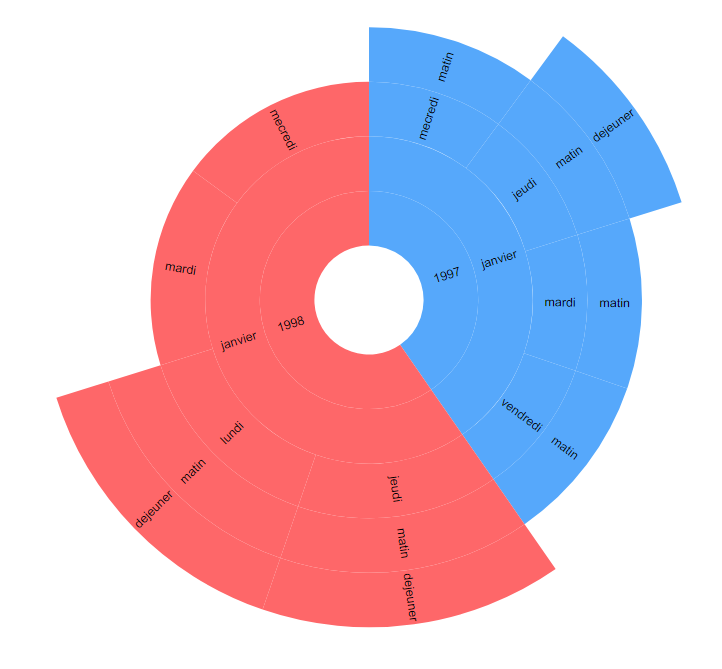
An example of Sunburst:
Group By : Split into many widgets
This option allows to transform firstly the widget into a container. This will then render a Sunburst chart for each different value provided by the selected field.
This allows to create sub-widgets of the same type dynamically which might contribute in increasing granularity.
The layout of the charts inside the container is configurable.
Please see the corresponding chapter to configure the view of the Widget container.
Post your comment on this topic.