
Using time series with multiple lines could cause trouble in the display if the datasource handle too much null values for specific time.
line plot missing
If the chart doesn’t displays all values as bellow :
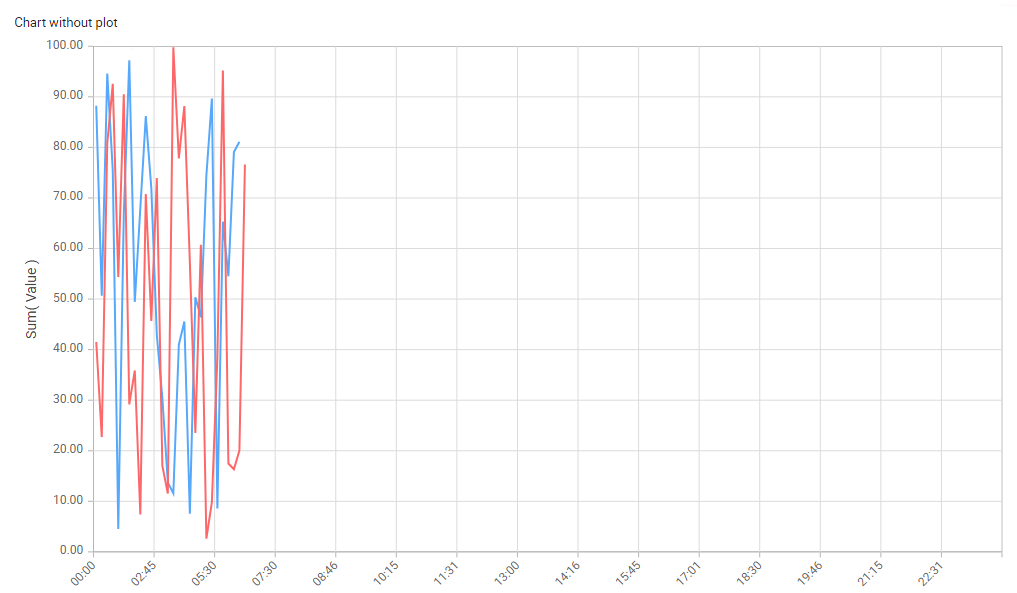
If the chart doesn’t display properly when null value occurs, the plot null values feature will solve the problem
Configuring the plot null values
Select the chart widget and edit the series property :

Go in the advanced tab and change the Plot null value option.

There is 3 modes :
- Do not plot : The normal mode where chart won’t draw line if there is null value
- Plot Average : Plot average data to prevent the problem to occurs
- Fallback value : use a specific value for null data
Once Plot null values is enabled, the data will be displayed correctly on the chart :

Last modified:
Feb 17, 2022
Post your comment on this topic.