Dashboard Layout
In the Dashboard activity tab, the main area shows the Dashboard layout canvas where some square tiles are displayed to guide you.
Created Widgets will appear on this layout canvas and can be re-arranged later.
For example, this is what a work in progress Dashboard will look like in this view :
Browsing for available Widget types
In the Dashboard activity tab, the top bar displays drawers that contain the Widget library :
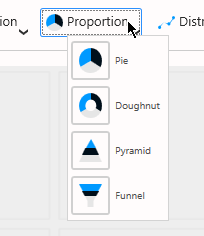
Click on a drawer to open it and list all widget types in this category :
Adding a Widget
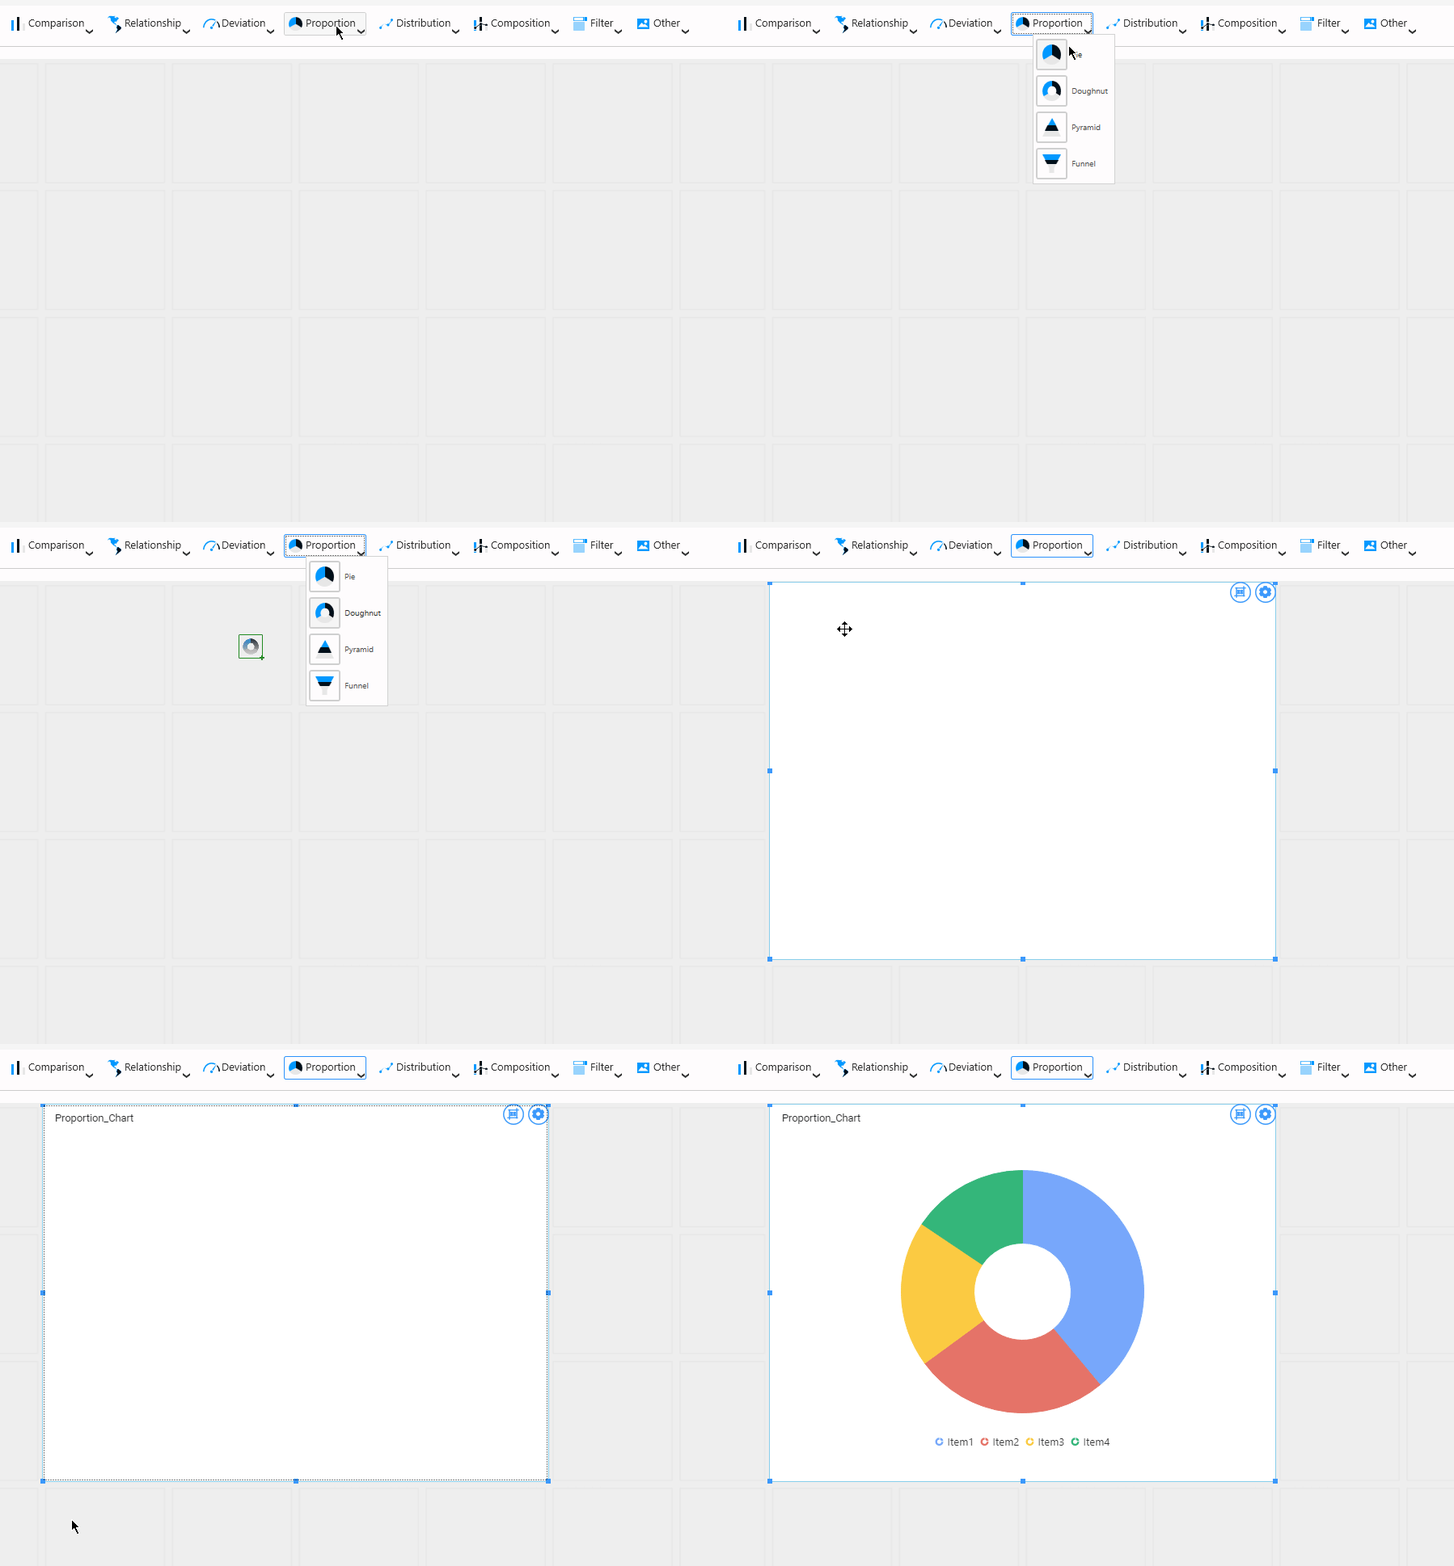
To add a Widget to the Dashboard, simply drag it from the drawer into any place in the layout canvas.
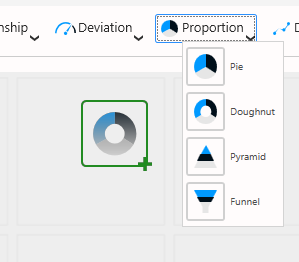
See the below animation for the full workflow :
Note : Sample values
When a Widget is created, it is not configured.
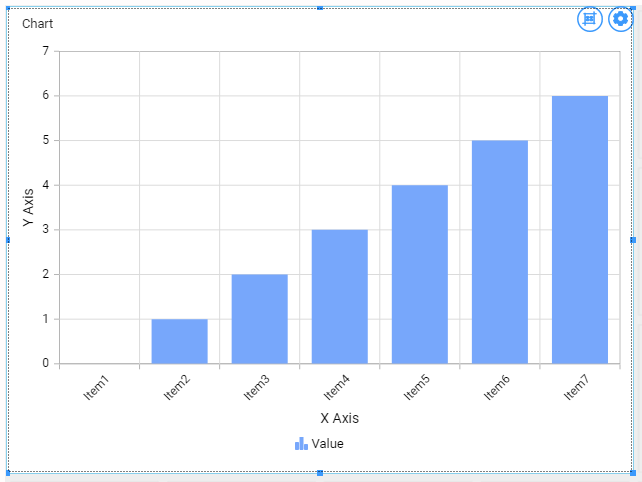
However, in order to help you choose a Widget Type and have an idea of what the Dashboard will look like, some sample data are displayed, like “Item1, Item2, …”.
This data is a placeholder only and is not related to any real data.





Post your comment on this topic.