Indexed Colors
By default, Series are assigned a color based on their index in the ordered list in which they appear (usually alphabetical order).
Item1 is assigned Color1, Item2 is assigned Color2, etc…
The palette has 15 colors. When there are more series items than 15, the colors assigned loop back to Color 1.
Default Palette (default)
To enable the Default Palette (it is enabled by default), check Use Default Palette under Series Palette :
The list of colors in the default palette is below :
Custom Palette
To start customizing the Default Palette, un-check Use Default Palette under Series Palette.
Then you can customize colors either by entering their hexadecimal code (#RRGGBB) :
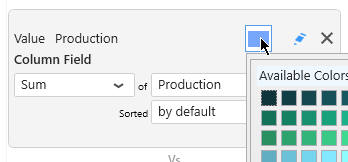
… or by clicking the color and using the graphical color picker :
When there is no data field bound to Split into same chart, there is also a shortcut to each serie’s color next to the series settings :
Value-based Colors
What are Value-based colors ?
But what if your series changes over time ?
For example, when binding a field as Split into the same chart, the items are generated dynamically from values in that field. Their index cannot be known in advance.
When items are renamed, added, or deleted from the data, the index of existing items will change, and their color will change !
This could happen simply during filtering at runtime for example.
Instead of index-based, you may then choose Value-based colors : the same value in the Series field will always have the same color in the Chart.
For this, simply check Use value-based colors under Series Palette :
Customizing Value-based colors
Value-based colors are defined at the Data Source level.
This is in order to allow re-use of the colors everywhere the same data is used.
To configure value-based colors, see the corresponding chapter Value-based Settings, under Transforming Data.


Post your comment on this topic.