Introduction
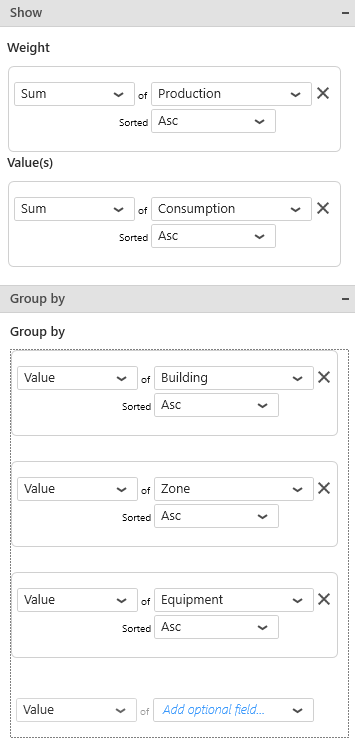
The following field containers are available for configuring data binding on a TreeMap :
- Weight : the size of the rectangles. If no “Value” is configured, this is also the color.
- Value : the color of the rectangles
- Group By : how we group values together to create separate rectangles
Weight
This represents the quantity we want to display on the TreeMap, and will bind for rectangle size.
If no “Value” field is configured, this field also binds to the color of the rectangles.
This field must be aggregated : you must choose an aggregation function (SUM, AVG, …)
This field is required.
Values
When a Values field is bound, it defines the color of the rectangles, while the first field now only defines the size of rectangles.
This field must be aggregated : you must choose an aggregation function (SUM, AVG, …)
This field is optional.
Example
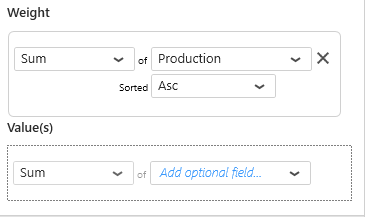
For example, you configure a single field “Production” :
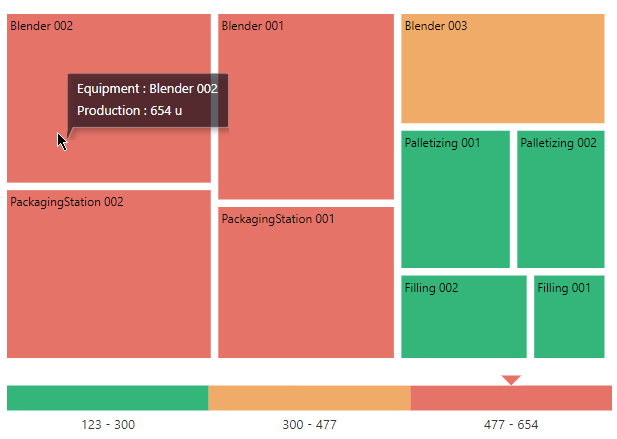
It defines both the size and color of rectangles.
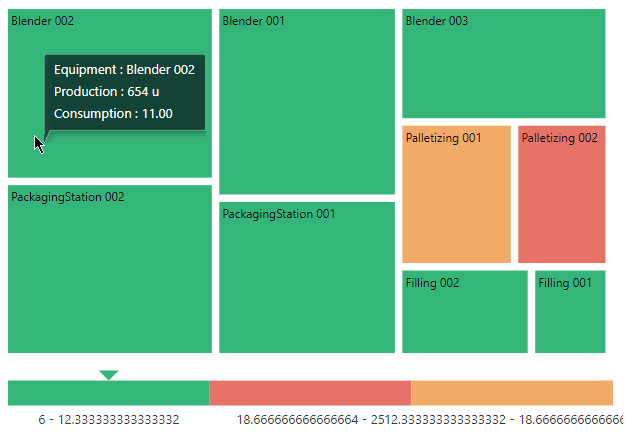
So for example Equipment “Blender_002” has value 654 which is high (large and red) :
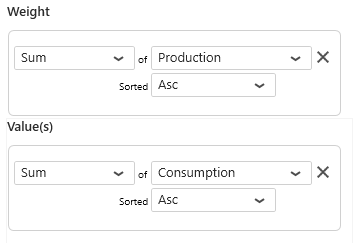
Now you configure as secondary field a “Consumption” :
Now the rectangles keep the same size (the Weight field is the same), but the color is different.
So for example Equipment “Blender_002” still has Quantity 654 which is high (large), but now the color is green because the secondary “Consumption” is low (11) :
Group By
This represents the category we want to use to separate rectangles.
These fields cannot be aggregated : they must have several separate values in order to group the “Values” aggregation.
Multiple fields : Grouping
When binding multiple fields at the same time, the rectangles will be grouped by the defined hierarchy.
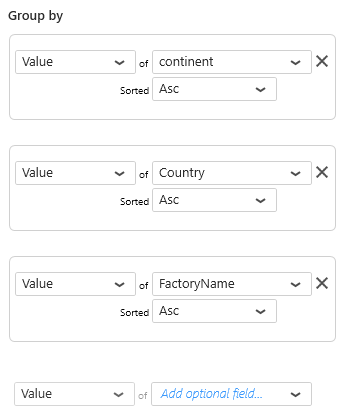
For example, binding fields Continent>Country>Factory :
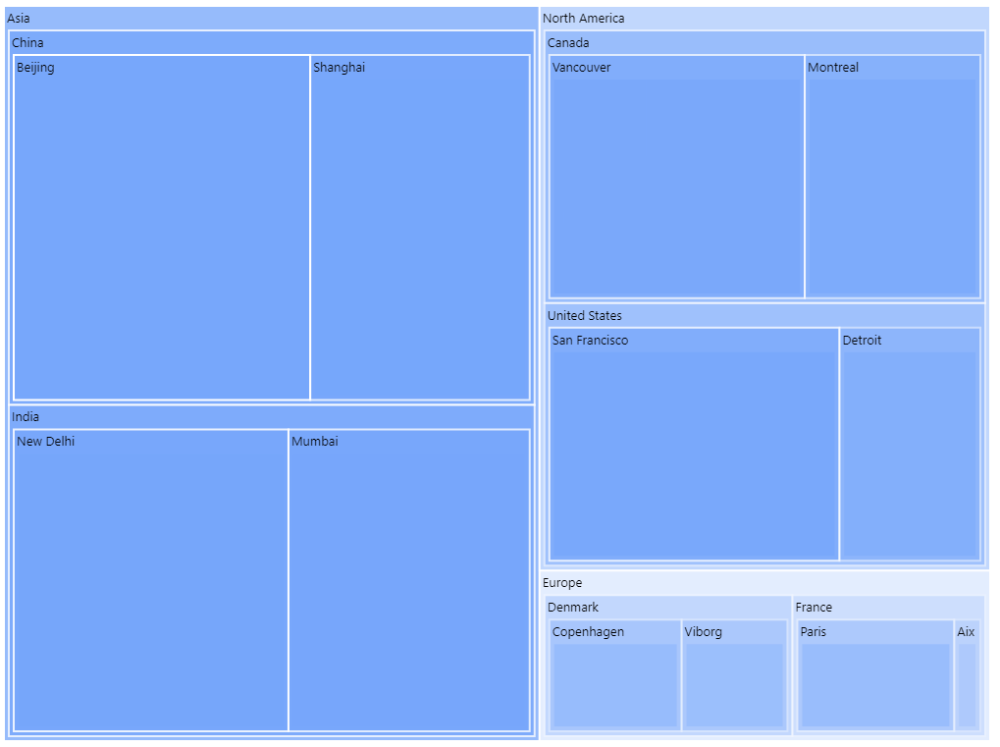
… will group factories by country and the countries by continent :
Multiple fields : Drill-Down
When binding multiple fields at the same time, it is possible instead to define Drill-Down : the user will navigate the hierarchy by clicking.
Under Basic Settings, select Enable DrillDown :
Now again the factories are grouped by country and the countries by continent.
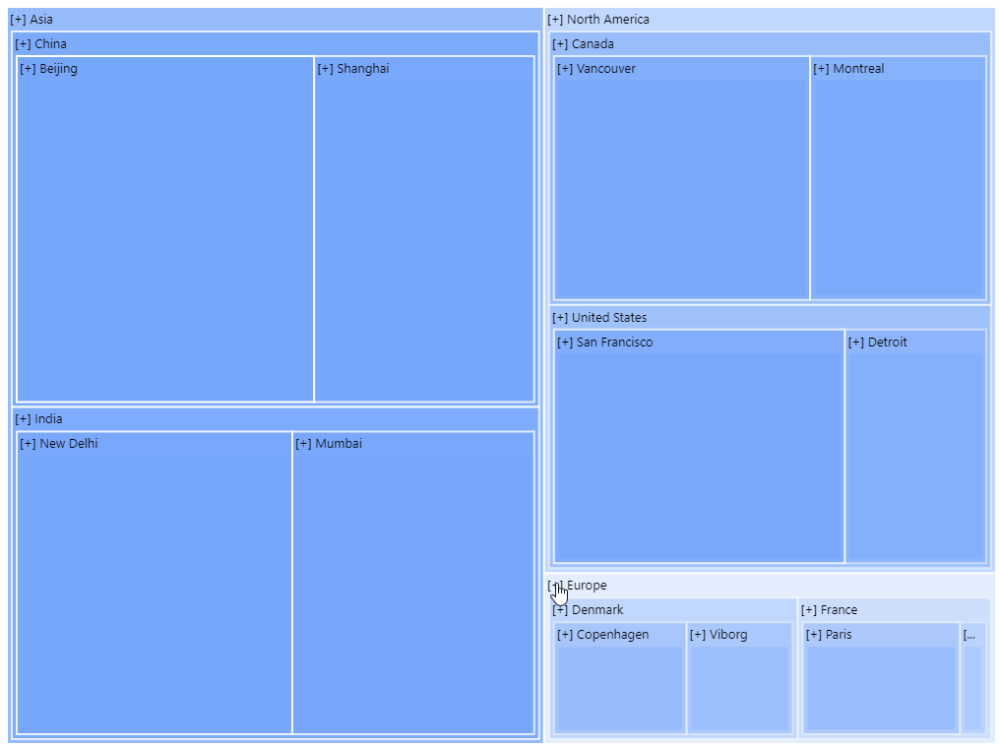
But in addition, this can be navigated by clicking on the [+] or [-] icon on shapes :
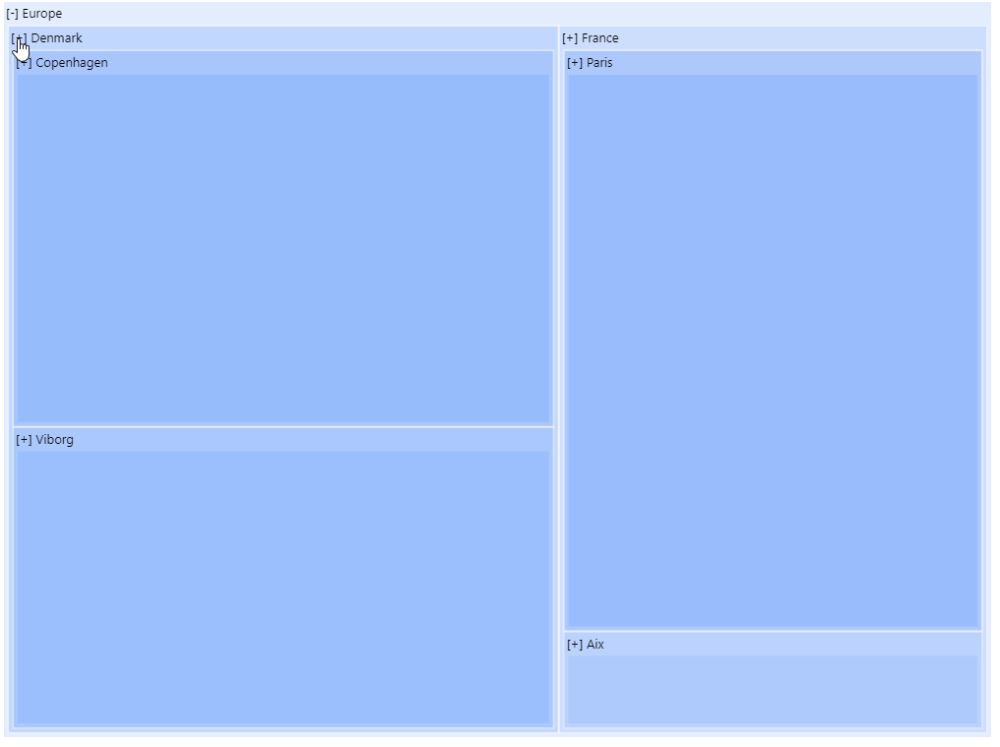
The User can click a Continent to drill down. For example, here clicking [+] on “Europe” brings focus to this level :
… and see a list of countries for that continent. Then clicking [+] on a Country brings focus on that Country :
… and see a list of Factories for that Country :
It is possible to click the [-] to navigate up the DrillDown.
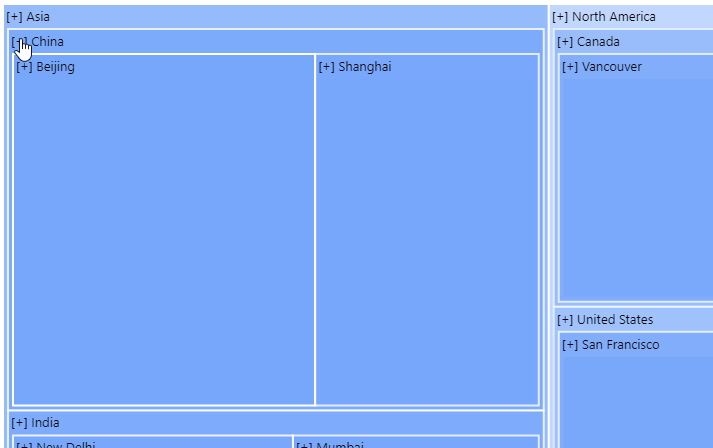
It is also possible to click on a lower level directly to navigate to it. For example, from top level, on can click directly a Country to drill down to this country and compare the Factories :







Post your comment on this topic.