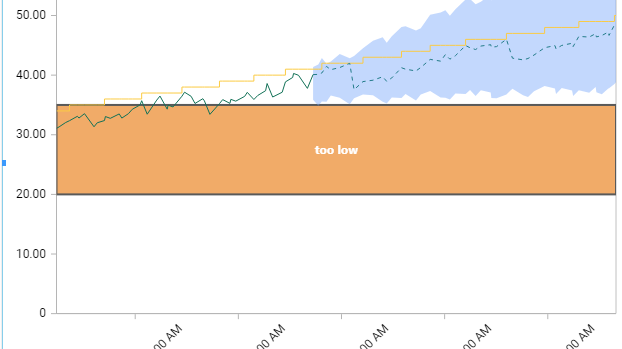
Strip Lines allow to change the background color of the full chart between a minimum and maximum Y value.
This can be useful for adding context information to a chart, for example the limit values of a measurement.
To open the Strip Line editor, click on Strip Line… :
Global Properties
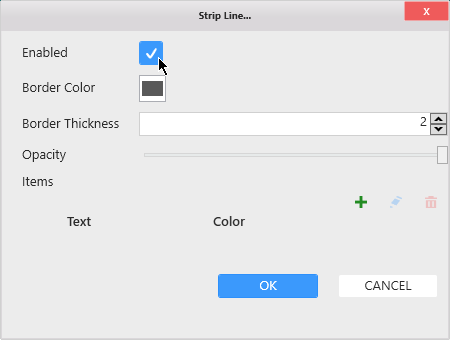
In the Strip Line… pop up window, the top part lists some global properties of the Strip Line :
Enable
Check the Enabled box to enable to Strip Line and start configuring.
Border
The Strip Line can have a border to better show where is starts and ends.
Use Border Color to set the color.
Use Border Thickness to set the thickness. A thickness of 0 means no border.
Opacity
The Strip Line can be made semi-transparent using the Opacity control.
This allows to integrate better with the background color of the theme and the rest of the chart.
Items
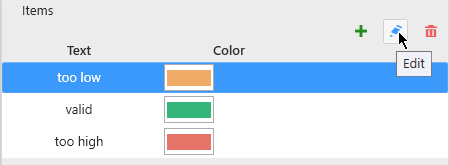
There can be several Y Axis Strip Lines, and they are all listed under Items.
Adding a Strip Line
To create a first Strip Line, click the + icon :
This opens the Items configuration pop-up window to let you configure this Strip Line.
See below for Configuring.
Later, to add more, use the + button again.
Editing a Strip Line
When Strip Lines exist, you can edit one by selecting it in the list and clicking the pen icon.
This opens the Items configuration pop-up window to let you configure this Strip Line.
See below for Configuring.
Removing a Strip Line
When Strip Lines exist, you can remove one by selecting it in the list and clicking the trash icon.
Configuring
Style and Appearance
The Style following options are available for each Strip Line :
Color : Fill color of the Strip Line.
Text : Text label displayed on the Strip Line. Leave empty to hide text.
Foreground : Text color
Text Alignment : Text position : at the start, end or middle of the Strip Line.
Start / End
The Start and End value can be configured statically :
In this example, it means the Strip Line will start on Y Value = 20 and end on Y Value = 35 :


Post your comment on this topic.