Introduction
The following fields are available for configuring data binding on a Proportion Chart :
- Part : the size of the portion (pie slice, doughnut slice, etc)
- Split into the chart : how we group values together to create separate portions
- Split into many charts : how we split series of different charts in the same container
Parts
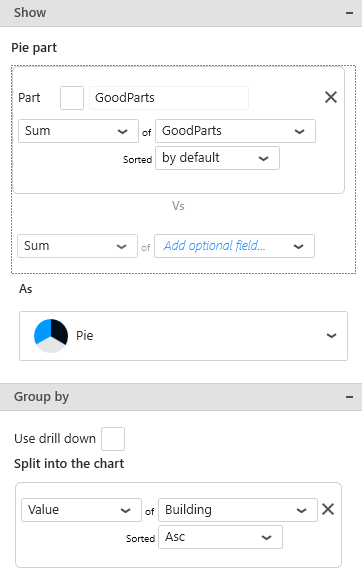
This represents the quantity we want to display on the Proportion Chart, and will bind to the size of the portion (pie slice, doughnut slice, etc).
These fields must be aggregated : you must choose an aggregation function (SUM, AVG, …)
At least one Part field must be configured, but it’s also possible to configure several.
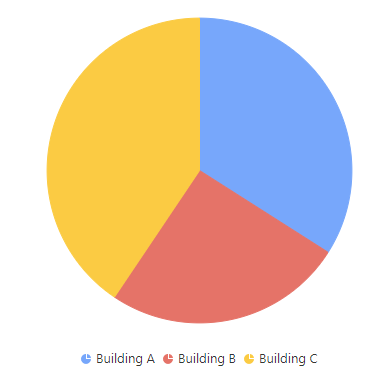
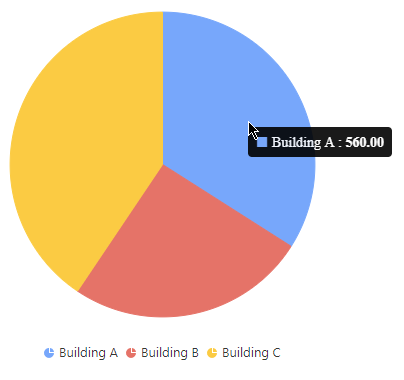
When a single Part field is used, the portions are separated by the values in the Split into the chart fields (see below).
When binding multiple Part fields at the same time, 2 behaviors are possible :
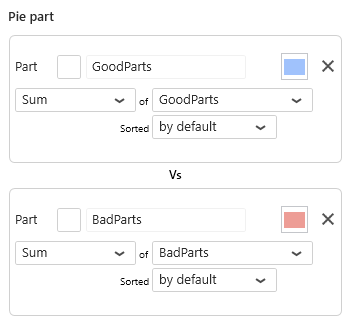
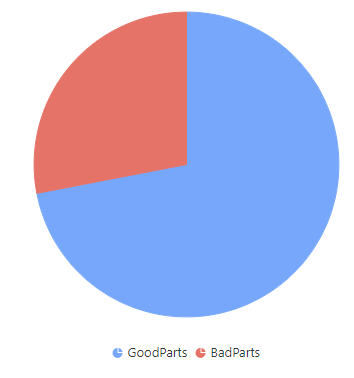
Multiple Part fields : multiple portions
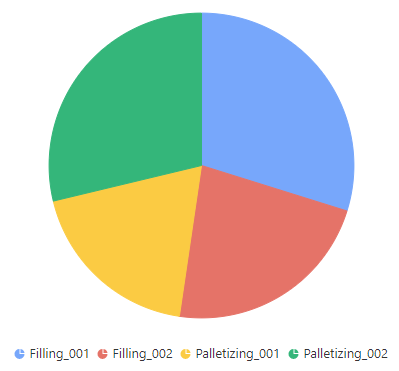
If there is no Split into the chart field, each Value field will generate a portion :
Multiple Part fields with Split into the chart : multiple series
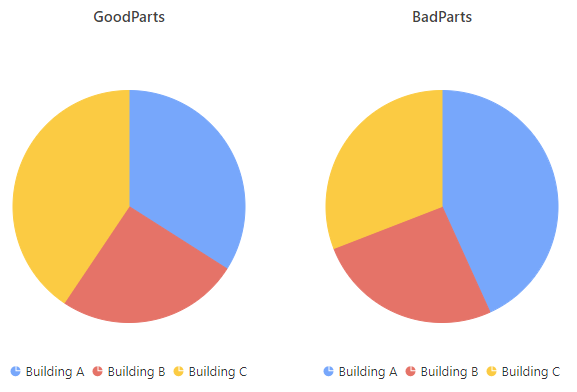
If a Split into the chart field is bound, each Part field will generate a separate Proportion Chart :
Split into the chart
This represents the category we want to use to dynamically separate portions on the Pie/Doughnut/etc.
These fields cannot be aggregated : they must have several separate values in order to group the “Values” aggregation.
Multiple Split into the chart fields : Drill-Down
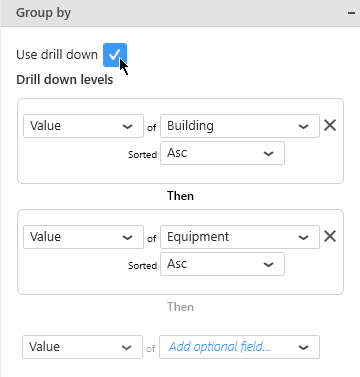
To enable Drill-Down, you can check the box Use drill down :
This allows to bind any number of fields to drill-down levels, in the same order as they are in the list.
To change the order of fields, see the corresponding chapter.
Example : With fields called “Building” and “Equipment”, the following configuration will configure the corresponding drill-down :
… drills down into :
Split into many charts
This represents the series field to generate a different contained Proportion Chart for each different value in this Split into many charts field.
This will turn the widget into a container, and generate a complete different chart for each value in the series field, contained in the Widget.
The layout of the charts inside the container is configurable.
Please see the corresponding chapter to configure the view of the Widget container.
Split into many charts Series with Split into the chart as portions
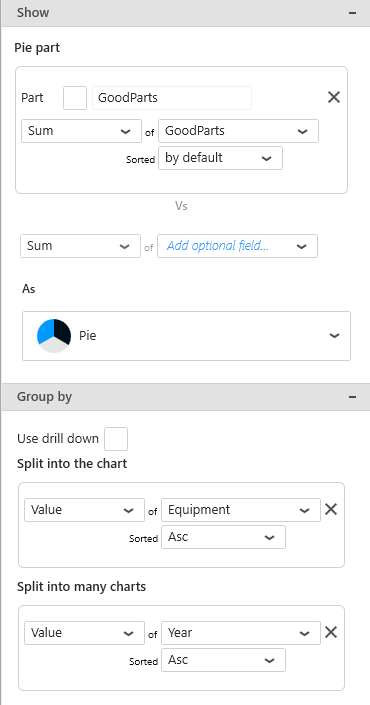
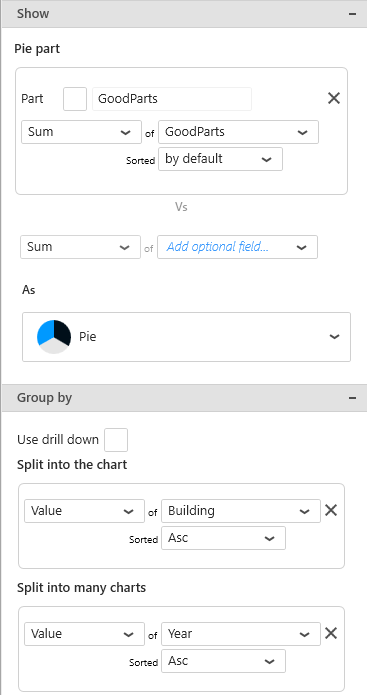
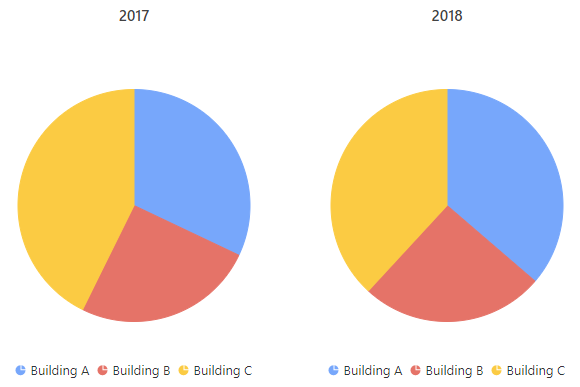
Example : Your GoodParts are compared by Building. If you have a field called “Year”, you may want to plot a completely separate chart for each value of Year :
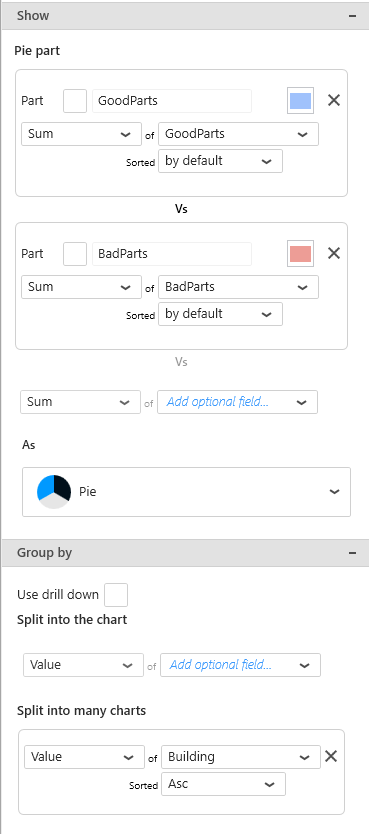
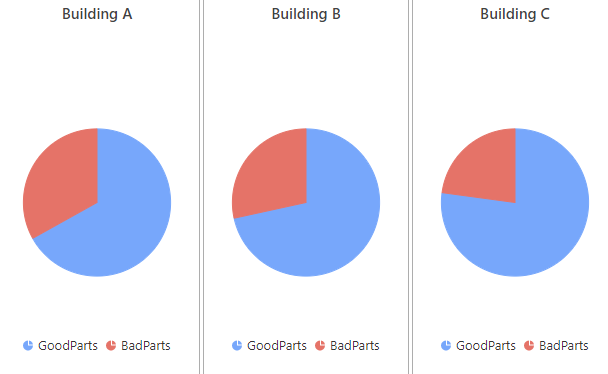
Split into many charts Series with multiple Parts as portions
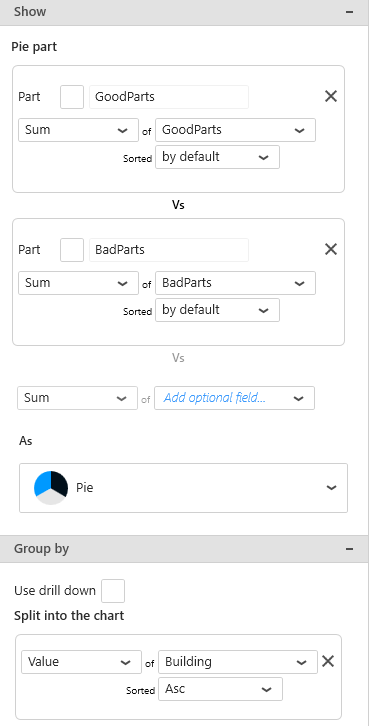
Example : Your GoodParts are displayed versus the BadParts. If you have a field called “Building”, you may want to plot a completely separate chart for each value of Building :
Split into many charts Series multiple Parts with Split into the chart as portions
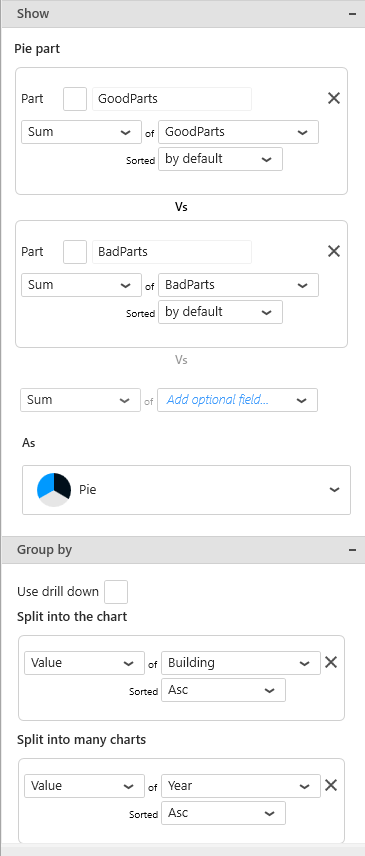
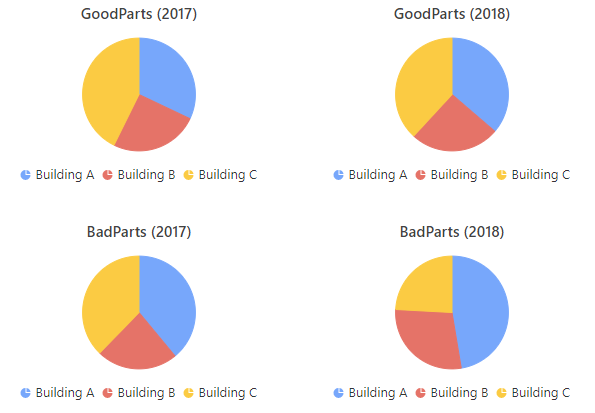
All three types of fields can also be configured together : each Part field will generate a separate chart for each separate value of the Split into many charts field, and the portions will be defined by the Split into the chart field.
Example : You want a separate chart for the GoodParts of each Year, and a separate chart for the BadParts of each Year, and on each chart you want to compare the Buildings values :
Split into many charts Series with synchronized Drill-Down
If Drill-Down is configured, it becomes synchronized between each chart in the series.




Post your comment on this topic.